Deaths by Sector
At the turn of the last century, we were unable to estimate the number of fatalities occurring at work, at home, and in public places, and motor-vehicle deaths were just starting to be an emerging safety problem. Today, we have much better data.
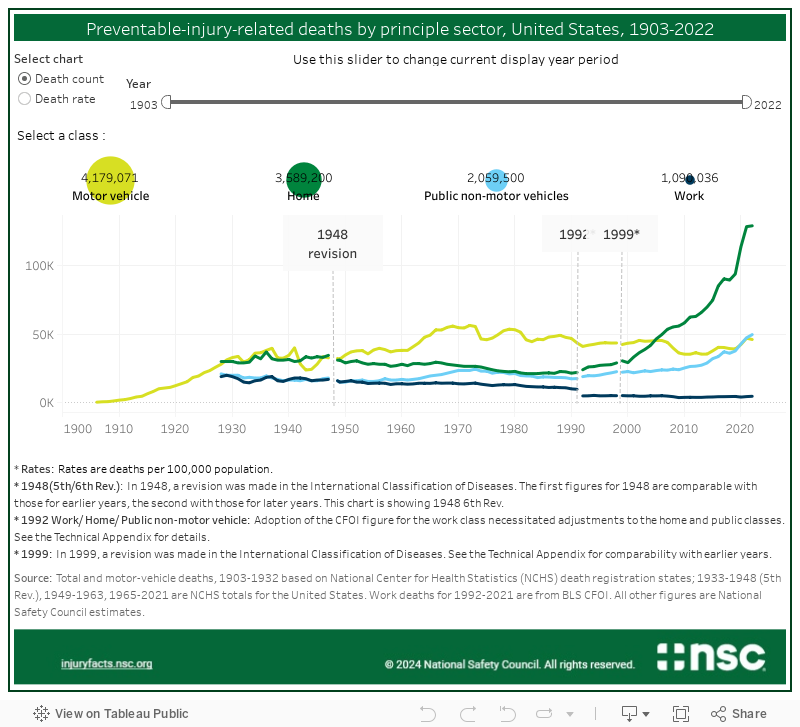
This interactive chart provides a historical look at preventable deaths by class: motor vehicle, work, home, and public non-motor vehicle.
From 1948 to 2004, motor-vehicle crashes were the leading cause of preventable death. Starting in 2005, preventable deaths in the home became most prevalent. The increase in home deaths is driven by an increase in older adult falls and poisonings, which are largely associated with the prescription opioid epidemic and fentanyl overdose deaths. In 2022, the most recent data year, preventable injury-related deaths increased only slightly. Overall injury-related deaths increased 0.9%, deaths in the home increased 0.5%, deaths in public places increased 4.9%, motor-vehicle deaths decreased 2.0%, and work deaths increased 5.0%.
The break in the lines at 1948 shows the estimated effect of changes in the International Classification of Diseases (ICD). The break in the lines at 1992 resulted from the adoption of the Bureau of Labor Statistics (BLS) Census of Fatal Occupational Injuries (CFOI) for work-related deaths. Another change in the ICD in 1999 also affects the trends.
- Chart
- Data Table