The odds given in the data tree and corresponding table are statistical averages over the whole U.S. population and do not necessarily reflect the chances of death for a particular person from a particular external cause. Any individual’s odds of dying from various external causes are affected by the activities in which they participate, where they live and drive, and what kind of work they do, among other factors.
Odds of dying for each data year are calculated using that year’s population and life expectancy. For example, the one-year 2021 odds are approximated by dividing the 2021 U.S. population (331,893,745) by the number of deaths. The lifetime odds are approximated by dividing the one-year odds by the life expectancy of a person born in 2021 (76.1 years). Please note that odds based on less than 20 deaths are likely to be unstable from year to year and are therefore not included in the table or data tree.
Statements about the odds or chances of dying from a given cause of death may be made as follows:
- The odds of dying from (manner of injury) in 2021 were 1 in (value given in the one-year odds column).
- The lifetime odds of dying from (manner of injury) for a person born in 2021 were 1 in (value given in the lifetime odds column).
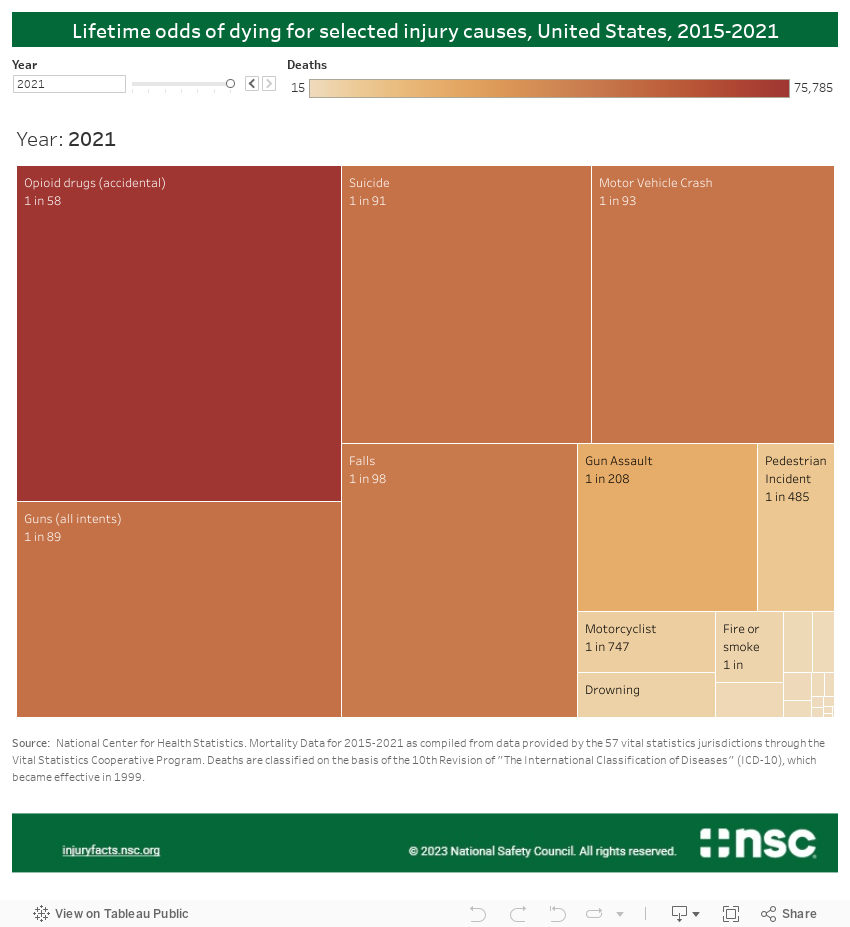
For example, referring to the fourth line of the table:
- The odds of dying from an accidental opioid drug overdose in 2021 were 1 in 4,379.
- The lifetime odds of dying in an accidental opioid drug overdose for a person born in 2021 were 1 in 58.
- Chart
- Data Table