The three most frequent causes of injury death are also among the top 20 causes of all deaths in the United States in 2021. Preventable/accidental injuries ranked 4th, intentional self-harm (suicide) ranked 11th, and assault (homicide) ranked 16th.
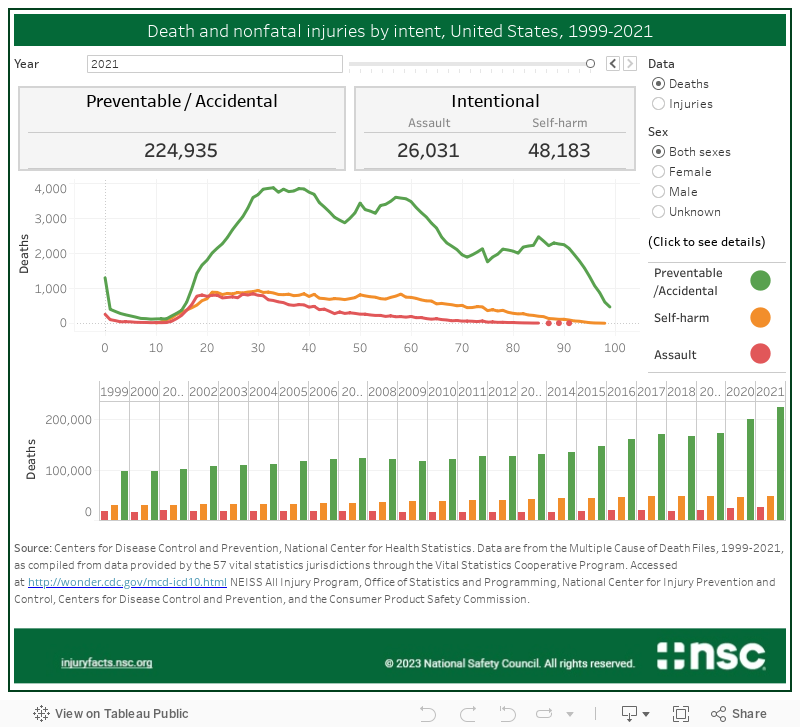
In 2021, suicides peaked among people in their 20s and stayed high into their 50s, while assault deaths also peaked among young adults in their 20s then quickly dropped starting in their 30s. In contrast, preventable/accidental death is persistently high across most age groups. Preventable/accidental deaths can be largely attributed to three main causes across a person’s lifetime: motor vehicle-related deaths among young adults, opioid misuse among adults in mid-life, and fall deaths among older adults.
Both accidental deaths and suicides have been increasing rapidly over the last decades. Although suicide deaths decreased in both 2019 and 2020, they still have increased 19% since 2012. Preventable/accidental deaths are continuing an upward trend and have increased 76% since 2012. Although the number of assault deaths had been relatively flat from 2002 through 2019, they have increased 36% in the last two years to total 26,031 in 2021.
Nonfatal injury trends are very different from fatal injury trends. While preventable injuries are far more common than either assault or self-harm nonfatal injuries, assault injuries outnumber self-harm injuries. In 2021, 21,497,380 people were treated in an emergency department for a preventable injury. Treatment for assault-related injuries numbered 1,392,061, nearly three times those treated for self-harm (49,943).
Nonfatal preventable injuries peak among children between 1- and 2-years-old, and again among 20- and 30-year-olds, before they gradually decline throughout life. Assault-related nonfatal injuries peak among 20 and 30 -year-olds, then decline steadily. Self-harm nonfatal injuries peak among teenagers, drop rapidly until about age 30, and then plateau until age 50, at which time they decrease again.
Use the interactive chart to explore other trends by injury intent, sex, and age.
- Chart
- Data Table