Monthly Preliminary Motor-Vehicle Fatality Estimates – February 2024
February motor-vehicle deaths down 12% from 2023
The number of miles driven in February 2024 increased 2.0% compared to February 2023, and is 16.0% higher than in 2021. The number of deaths for February 2024 is estimated to be 2,840. This preliminary estimate is down 7% from 2023 and down 12% from 2022. With the number of deaths down, combined with an increase in miles driven, the monthly mileage death rate decreased 9.2% compared to 2023. The mileage death rate per 100 million vehicle miles driven for February 2024 is 1.18, compared to 1.30 in February 2023, 1.39 in February 2022, and 1.35 in February 2021.
Mileage source: Federal Highway Administration
- Chart
- Data Table
Through February 2024, motor-vehicle deaths decreased by more than 25% in 10 states compared to 2023:
- Rhode Island (-75%, 15 fewer deaths)
- Wyoming (-63%, 17 fewer deaths)
- Alabama (-38%, 52 fewer deaths)
- Kansas (-37%, 19 fewer deaths)
- Iowa (-31%, 14 fewer deaths)
- Alaska (-29%, 2 fewer deaths)
- Delaware (-29%, 6 fewer deaths)
- Georgia (-29%, 75 fewer deaths)
- Arkansas (-27%, 27 fewer deaths)
- California (-26%, 142 fewer deaths)
Nine states and the District of Columbia experienced an increase of more than 10% compared to 2023:
- Maine (+125%, 10 more deaths)
- Minnesota (+80%, 24 more deaths)
- District of Columbia (+80%, 4 more deaths)
- Mississippi (+43%, 38 more deaths)
- Montana (+41%, 7 more deaths)
- North Dakota (+38%, 3 more deaths)
- Nevada (+38%, 16 more deaths)
- Nebraska (+38%, 9 more deaths)
- New York (+13%, 11 more deaths)
- Connecticut (+13%, 6 more deaths)
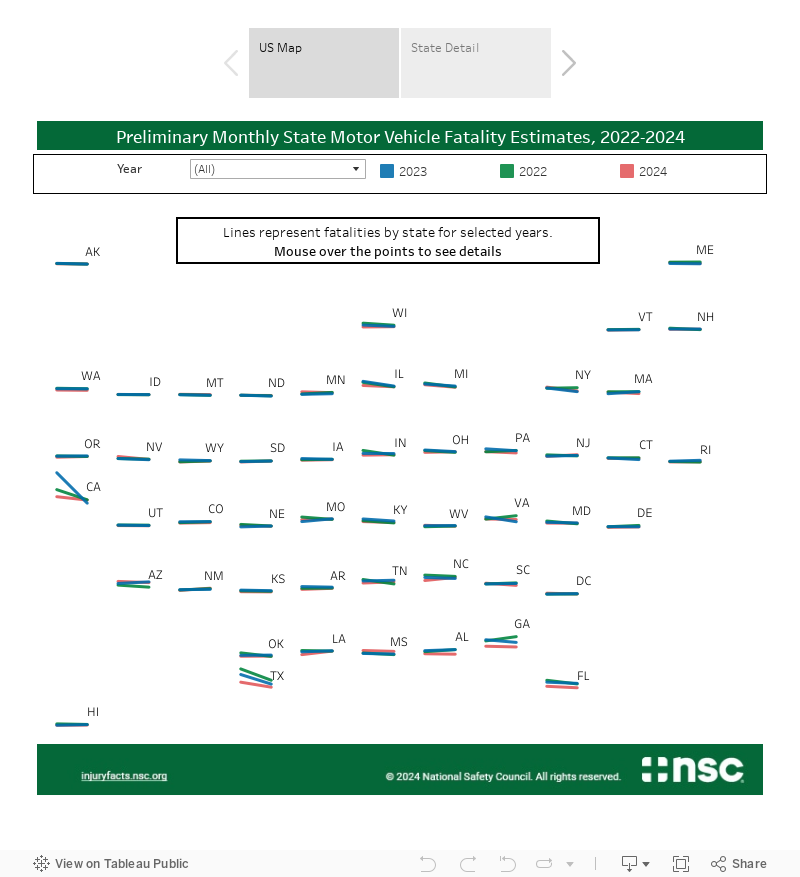
The line chart compares the 2024 monthly fatality trends against the 2023 and 2022 trends. Adjust the filter to select which years to compare. In February 2024, 21 states reported fewer deaths compared to February 2023 preliminary reports, 1 state reported no change, and 28 states and the District of Columbia reported more deaths in February 2024 than February 2023. Please use the data table to view detailed state preliminary estimates.
- Chart
- Data Table
NSC preliminary motor-vehicle fatality estimates do not include U.S. territories.
How the National Safety Council Calculates Crash Fatality Estimates
The National Safety Council (NSC) collects preliminary motor-vehicle fatality estimates from data reporters in all 50 states and the District of Columbia. State data reporters generally work in state Department of Transportation offices and are often the same individuals responsible for providing data to the National Highway Traffic Safety Administration’s (NHTSA) Fatality Analysis Reporting System (FARS).
Each month, state data reporters provide a first estimate for the previous month’s fatalities and updated estimates for all previously reported months.
NSC maintains a three-year database of all state motor-vehicle fatality estimate reports. Using January as an example, the NSC database includes the January estimate first reported in February, as well as any updated January estimates reported in March, April, May, June, July, August, September, October, November, and December.
Fatality estimates tend to mature over the course of the year. Numbers often increase as fatalities are confirmed. Because of the maturation of the data, NSC calculates year-to-year percent change estimates by comparing monthly motor-vehicle estimates of comparable maturity.
To calculate national fatality estimates, percent change estimates are multiplied by the most recently available final motor-vehicle fatality estimates reported by the National Center for Health Statistics (NCHS). Therefore, NSC estimates reflect the NCHS definition of motor-vehicle fatalities as both traffic and non-traffic deaths that occur within a year of the incident. Since NHTSA counts only traffic deaths that occur within 30 days of the incident, NSC motor-vehicle fatality estimates are not comparable to NHTSA figures.
All state level data are displayed as reported by each state. All fatality estimates are preliminary. To ensure proper comparisons, 2023 state fatality estimates are preliminary figures covering the same reporting period as those for 2024. In other words, preliminary 2024 estimates are compared to preliminary 2023 and 2022 estimates, even if updated estimates are available.