COVID-19
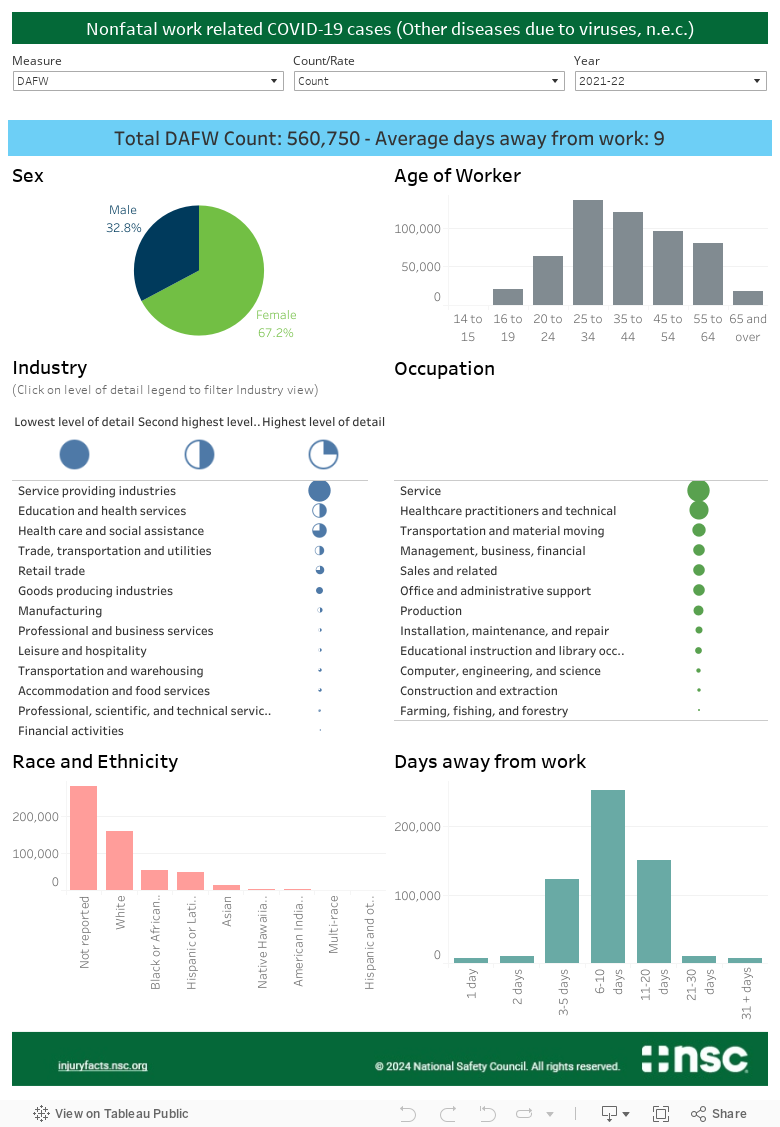
COVID-19 cases continue to impact the number and rate of nonfatal injuries and illnesses in 2021-2022. Starting in 2020, 390,020 DAFW cases were categorized as “other diseases due to viruses not elsewhere classified,” which includes reported COVID-19 related illnesses. No cases in this category have been reported since 2016, so it may be assumed that all or nearly all of the 390,020 DAFW cases in 2020 involved COVID-19. The latest 2021-2022 data show that an additional 560,750 DAFW cases have been reported (an average of 280,375 cases per year).
Unfortunately, no data are available regarding work-related or occupational fatalities related to COVID-19. The U.S. Bureau of Labor Statistics (BLS) excludes fatal occupational illness cases from its surveillance programs because of the difficulty of quantifying illness cases that often involve extended latency periods between the occupational exposure and onset of illness.
Because of illness cases related to COVID-19, the leading cause of DAFW cases in 2021-2022 is “exposure to harmful substances or environments.” Prior to 2020, this event type was the sixth ranked cause.
Using the interactive chart, several trends become clear. First, females are highly over represented, experiencing 67.2% of DAFW COVID-19 cases and an incident rate 175% higher than males. Second, over half of DAFW cases occurred in the Health Care and Social Assistance Industry (55%). The Health Care and Social Assistance Industry experienced a COVID-19 DAFW case rate of 104.7 per 10,000 workers, compared to the all industry average of 28.2. Lastly, 99% of the COVID-19 DART cases involved days away from work (DAFW). The data on nonfatal cases cover occupational injuries and illnesses and come from the BLS Survey of Occupational Injuries and Illnesses (SOII) for 2011-2022. Starting in 2021, biennial estimates are available for DAFW, DJTR, and DART cases. This page highlights both DAFW and DART estimates. The latest estimate period available reflects cases occurring in 2021 and 2022. Because DAFW data transitioned from annual reporting to biennial reporting in 2021, care should be used when comparing 2020 to 2021-2022.
- Chart
- Data Table
Source: Bureau of Labor Statistics, U.S. Department of Labor.