How to Benchmark
Safety professionals often want to compare, or benchmark, the occupational injury and illness incidence rates of their organizations with national average rates compiled by the U.S. Bureau of Labor Statistics (BLS) through its annual Survey of Occupational Injuries and Illnesses (SOII).
The incidence rates available using this interactive tool provide data from 2014 through 2024 and were compiled under the revised OSHA recordkeeping requirements that went into effect in 2002.
First, Calculate Your Incidence Rates
The first step in benchmarking is to calculate the incidence rates for your organization. The basic formula is (N x 200,000)/EH, or the number of cases (N) multiplied by 200,000 then divided by the number of hours worked (EH) by all employees during the time period, where 200,000 is the base for 100 full-time workers (working 40 hours per week, 50 weeks per year). By referencing the data on your OSHA 300 log and using this calculator you can determine your organization’s injury and illness rates.
- Total recordable cases: Use the total number of cases on your OSHA 300 log.
- Cases with days away from work: Count cases with a check in column H of your OSHA 300 log.
- Cases with job transfer or restriction: Count cases with a check in column I of your OSHA 300 log.
- Other recordable cases: Count cases with a check in column J of your OSHA 300 log.
- Number of hours worked: Total hours worked by all employees as reported on your OSHA 300A log under establishment information.
Please note: The DART rate reflects cases with days away from work, job restrictions, or transfers.
Next, Find Industry Benchmark Data
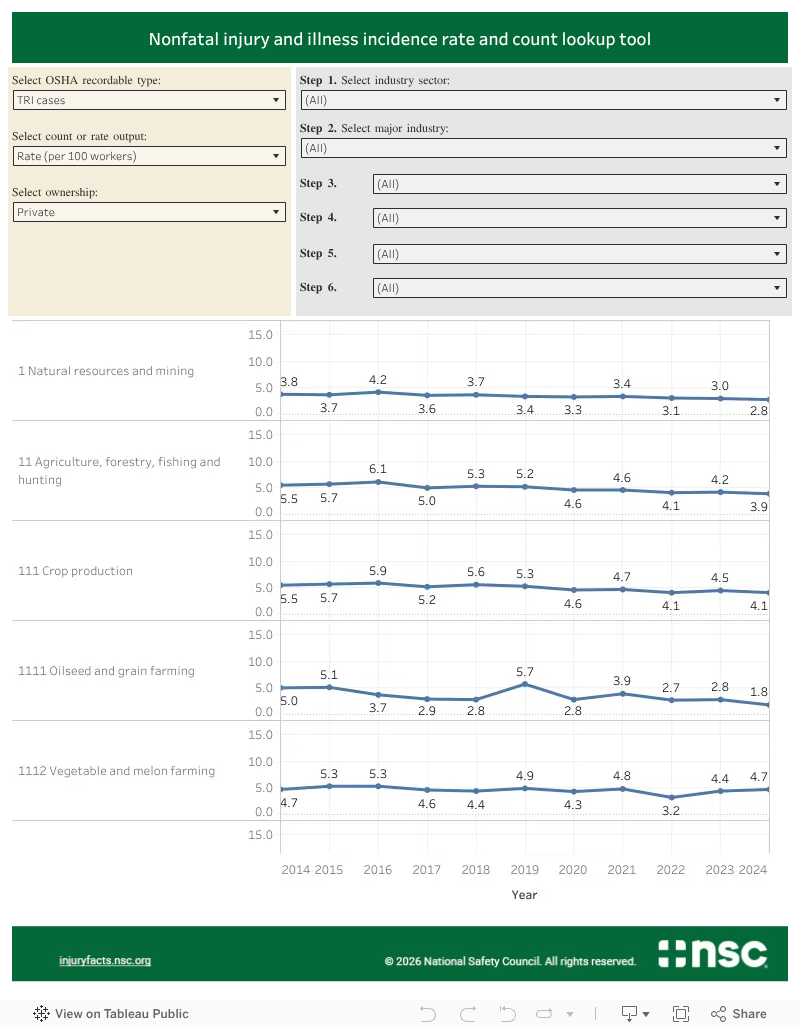
After computing your rates, the next step is to find benchmark data for your industry. Injury data are organized using the North American Industry Classification System (NAICS). Use the Nonfatal Injury and Illness Incidence Rate and Count Lookup Tool to find your industry data in a few simple steps:
- Step 1: Select your industry sector (Natural Resources, Construction, Manufacturing, etc.).
- Step 2: Select your major industry group.
- Steps 3-6: Continue through the steps to drill down to your specific industry.
The lookup tool’s output is displayed below the six steps. Compare to see if your organization’s rates are higher or lower than national averages. You can also view the number of nonfatal injuries by adjusting the Count/Rate filter.
BLS published the count and rate of injuries and illnesses annually for the following measures:
- Chart
- Data Table