Most Dangerous Industries
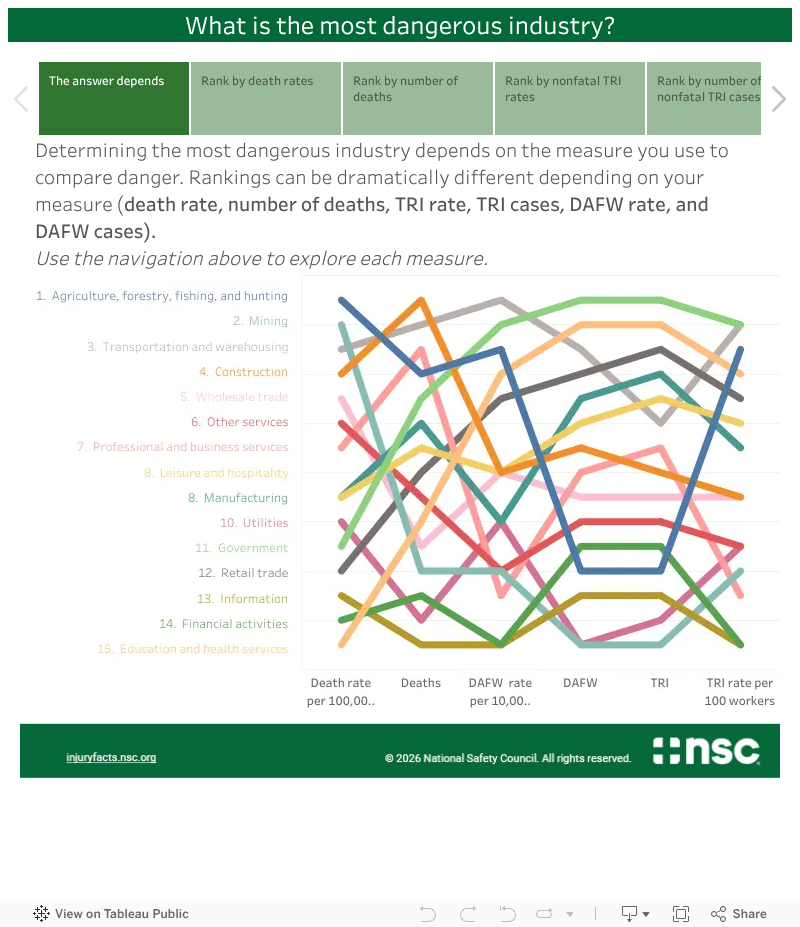
When exploring work-related injury, illness, and fatality trends, the question “What is the most dangerous industry?” often comes up. Because work-related “danger” is defined in several different ways, there is no one answer to this seemingly simple question.
In 2024, depending on the measure used, each of these four industries could be ranked as most dangerous:
- Agriculture, forestry, fishing and hunting– experienced the highest death rate per 100,000 workers
- Construction– experienced the most workplace deaths
- Transportation and warehousing along with State and local governments– experienced the highest recordable injury and illness rate per 100 workers (TRI rate)
- State and local governments– experienced the most recordable nonfatal injury and illness cases (TRI cases)
- Transportation and warehousing– experienced the highest injury and illness rate involving days away from work per 10,000 workers (DAFW rate)
- State and local governments– experienced the most nonfatal injuries and illnesses involving days away from work (DAFW cases)
Since 2020, the nonfatal injury and illness case rankings have been impacted by COVID-19 illness cases. Largely because of fluctuations in COVID-19 illnesses, the education and health services industry moved from the seventh ranked industry in 2019, to the highest ranked in 2020, to fourth ranked since 2023 regarding nonfatal injury and illness rates involving days away from work.
Please note: Caution should be used when interpreting the industry rankings for 2019. The U.S. Bureau of Labor Statistics (BLS) did not report fatality data at the private industry level for several major industry sectors in 2019 (Professional and business services, Information, and Manufacturing). BLS indicates these industries did not meet publishable standards for 2019. BLS suppresses industry estimates if they don’t meet certain criteria for both reliability and confidentiality.
Use the interactive chart to explore each of these measures and how the rankings have changed over time.
- Chart
- Data Table
Source: National Safety Council analysis of BLS data