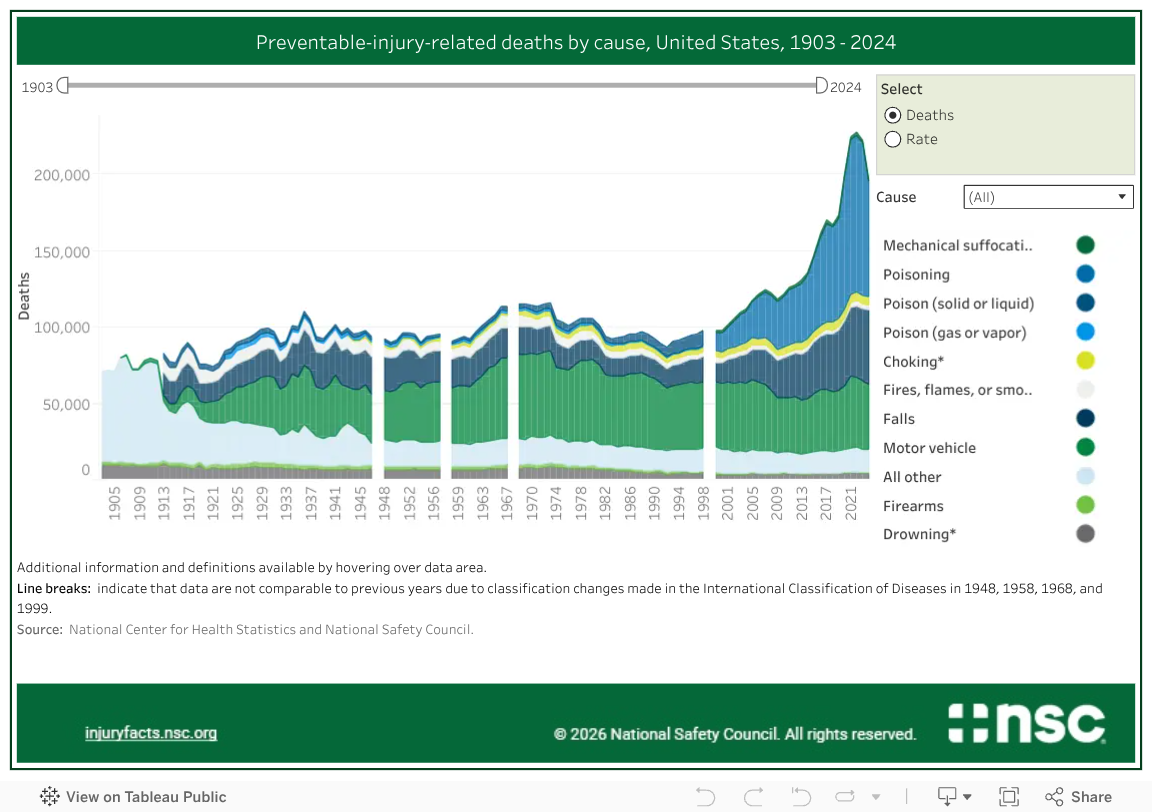
Deaths by Cause
In the early 1900s, most preventable deaths were not assigned a specific cause. Now, nearly all deaths are classified, and this improved coding allows us to better track the historic trends related to cause of death.
In the early tracking of mortality data (1903-1936), the number of deaths increased (56%), while the death rate actually decreased (1%). Because the number of deaths and the death rate can differ, it is important to consider both when examining trend data. In this case, the U.S. population increased at a faster rate than the rise in fatalities.
Death rates control for the changes in the population size, allowing you to better understand if an increase in deaths is associated with increased risk or is simply a reflection of a growing population.
A period of rapidly increasing deaths (+26%) and death rates (+9%) occurred between 1961 and 1973. These increases were largely driven by surges in motor-vehicle deaths (+46%) and death rates (+26%).
The longest period of improvement in preventable deaths and rates occurred between 1973 and 1992. During this time, deaths decreased 33% and death rates declined 38%. In 1992, the United States achieved the lowest recorded death rate of 34.0 deaths per 100,000 population. This drop was once again driven by motor-vehicle deaths, which decreased 35%. Throughout the 1960s, there was a comprehensive government response to auto safety issues that can be attributed to this decrease, culminating with Congressional authorization for the federal government to set safety standards for cars in 1966. Within two years, seat belts, padded dashboards, and other safety features became mandatory equipment.
Although deaths dipped in 2018 for the first time in a decade, they shot back up starting in 2019. From 2018 to 2022, deaths increased 36%. Breaking this trend, deaths decreased 1.9% in 2023 and 11.3% in 2024. 2024 experienced the fewest preventable deaths and the lowest death rate since 2019 with 197,446 deaths and a rate of 58.1 deaths per 100,000 population. Despite recent improvement, since 1992, deaths have skyrocketed 127% and death rates have risen 71%. This upward trend is linked to a dramatic climb in poisoning deaths driven by the opioid epidemic, as well as increases in older adult falls and motor-vehicle fatalities.
- Chart
- Data Table
Source: National Safety Council estimates. See Technical Appendix for comparability.