Sports and Recreational Injuries
Sports and recreational injuries increase 17% in 2024
Following a record low number of sports and recreational injuries reported in 2020, injuries increased 20% in 2021, 12% in 2022, 2% in 2023, and now 17% in 2024. The Consumer Product Safety Commission (CPSC) reported that in the first seven months of the COVID-19 pandemic, amid the majority of shelter-in-place restrictions, visits to emergency departments for consumer product-related injuries fell 24% (see the consumer product injury page). The largest decreases were in sports-related injuries. Injuries associated with track and field, lacrosse, hockey, soccer, baseball, softball, football, and basketball all saw reductions of more than 60% from March through September 2020. Sports injuries saw the largest decreases in the younger to late teen ages in the 2020 period. The CPSC attributes these large decreases to the suspension of school and youth sports leagues in the spring and summer months of 2020, in response to the pandemic.
Because the sports and recreational injury data presented here reflect only emergency department visits, and not injuries that are self-treated or treated in doctor’s offices/urgent care centers, it is not clear if injuries actually decreased in 2020 or if just visits to emergency departments to treat the injuries decreased.
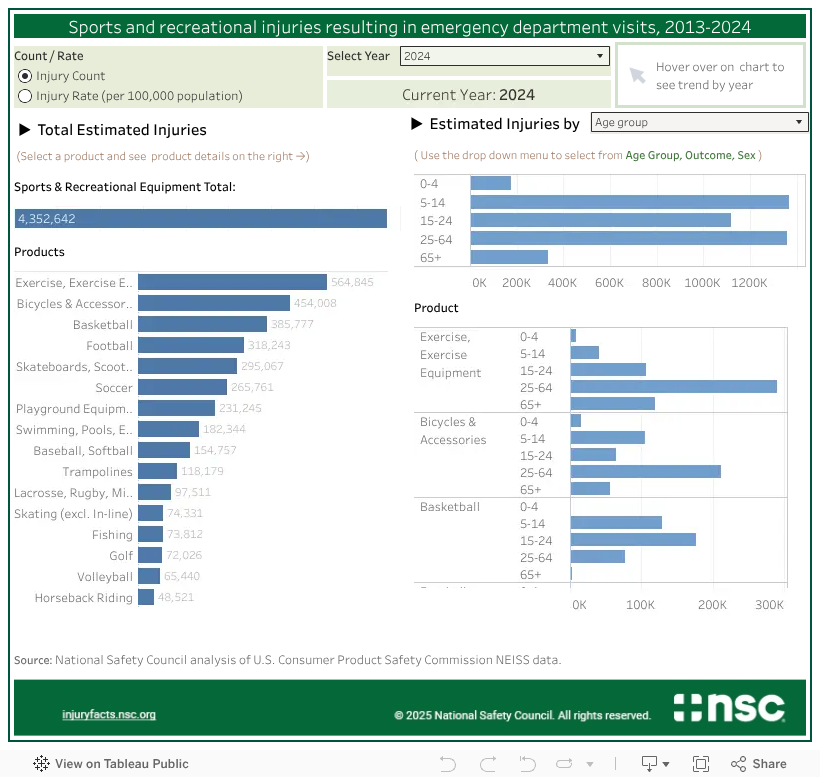
In 2024, 4.4 million people were treated in emergency departments for injuries involving sports and recreational equipment. The activities most frequently associated with injuries are exercise, cycling, and basketball.
This interactive table provides estimates of the number and rate of injuries treated in hospital emergency departments associated with various sports and recreational activities. Because the list of sports is not complete, and the frequency and duration of participation is unknown, no inference should be made concerning the relative safety of these sports and recreational activities.
Use this table to explore the frequency of injuries by specific sport or activity, the age groups most often injured, and the sex most often injured. It will also detail if the victim was treated and released. For example, with regard to exercise and exercise equipment injuries, the number of injuries increased 17% in 2024 (564,845 injuries in 2024 compared to 482,886 injuries in 2023), the age group with the highest injury rate is 15- to 24-year-olds, more males are injured than females (326,271 males vs. 238,326 females), and 90% of injury victims are treated in emergency departments and released.
- Chart
- Data Table