The six leading causes of death caused by unintentional injury in 2024
#1: Poisoning: 75,761 deaths
- Average of 22.28 deaths per 100,000 population
- Rate increased steadily from 0.8 at age 15 to its peak of 46.0 at age 43
- Leading cause of preventable death for all ages combined for the 12th consecutive year
- Leading cause of preventable death for every age from 25 to 68
- Largely due to the opioid epidemic affecting millions of people in the United States
- On an average day, 140 people die from preventable poisonings due to opioid drugs
#2: Falls: 47,026 deaths
- Average rate of 14.0 deaths per 100,000 population
- Beginning at about age 67, the death rate from falls increased dramatically
- Surpassing the number of motor-vehicle and poisoning deaths at age 70 and remaining higher throughout the lifespan, peaking at age 88
- Death rate peaked at age 98, with a rate of 757.6 per 100,000 population
#3: Motor-vehicle crashes: 42,789 deaths
- Average rate of 12.58 deaths per 100,000 population
- Death rate peaks at 16.3 for 29-year-olds and again at 28.7 for 87-year-olds
- Leading cause of preventable death for every age from 5 to 24
- Second leading cause of preventable death for every age from 25 to 66
#3: Choking: 5,923 deaths
- Average rate of 1.74 deaths per 100,000 population
- Death rates due to choking on inhaled or ingested food or other objects were quite low for most ages
- Rates rose rapidly beginning at about age 71
#5: Drowning: 4,201 deaths
- Average rate of 1.24 deaths per 100,000 population
- While relatively stable and low for all ages, the death rates for drowning showed peaks in the first few years of life and again at some very old ages
- Leading cause of preventable death from age 1 through 4
#6: Fire, Flames, or Smoke: 3,155 deaths
- Average rate of 0.93 deaths per 100,000 population
- Slightly elevated at very young ages; death rate peaked at age 98, with a rate of 5.1 per 100,000 population
The graph below depicts U.S. deaths and death rates per 100,000 population for the six leading causes of unintentional injury-related deaths in 2024 by age, through age 99. Additional years of data are also available by adjusting the filters.
- Chart
- Data Table
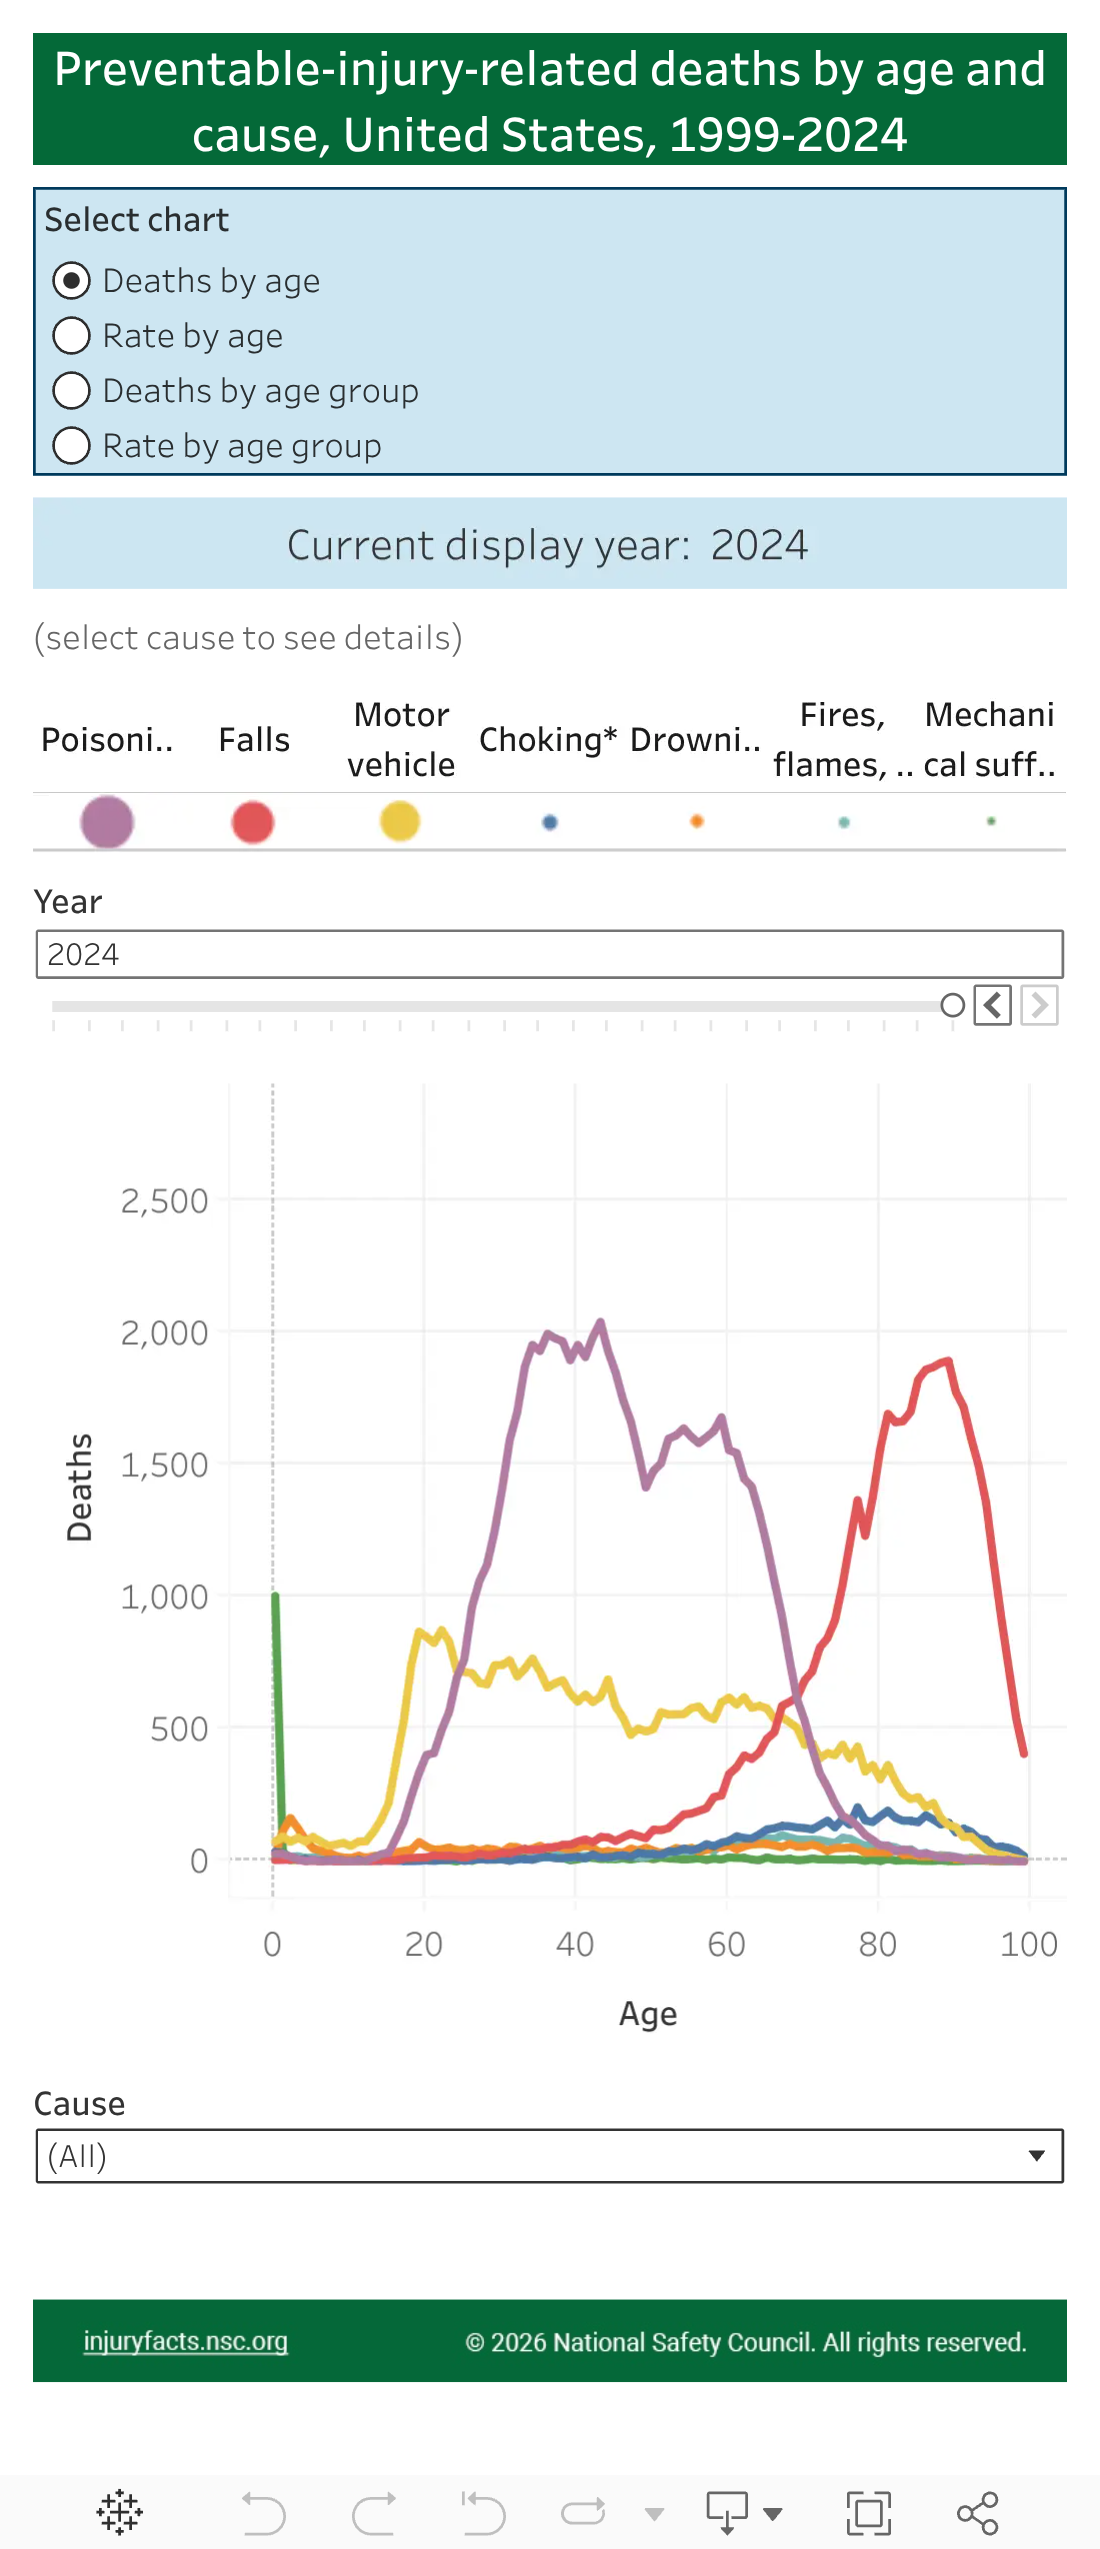
Among infants younger than 1, mechanical suffocation was the leading cause of preventable-injury death, followed by motor-vehicle incidents. Drowning deaths were the leading cause of death from 1 to 4 years of age, closely followed by motor vehicle.