National Safety Council analysis of NHTSA pedestrian traffic fatality data shows a general decline in the number of pedestrian fatalities from 1994 through 2009. Starting in 2010, pedestrian fatalities have been trending up. In 2023, pedestrian deaths decreased for the first time since 2019 and continued to decrease in 2024, with an improvement of 6.7% from 2022. Pedestrian fatalities as a percent of all traffic fatalities increased steadily from 2005 through 2018, from 11.2% to 17.3%, respectively. The percentage of pedestrian deaths has now increased for four consecutive years, accounting for 18.0% in 2024.
- Chart
- Data Table
While pedestrians accounted for about 18.0% of traffic deaths in 2024, this percentage varies by age. Pedestrians represent 20% or more of traffic deaths among 35- to 74-year-olds. The largest number of pedestrian deaths occurs among 35- to 44-year-olds (1,391). While children aged 5 to 9 experienced the fewest number of pedestrian deaths (48) in 2024, these deaths still represented over 15.8% of all traffic deaths for this age group.
- Chart
- Data Table
Alcohol impairment was a factor in 37% of all pedestrian fatal crashes in 2024, accounting for about 2,607 deaths. The pedestrian is the only impaired individual 22% of the time, the driver is the only individual impaired 11% of the time, while both the pedestrian and the driver are impaired 5% of the time.
- Chart
- Data Table
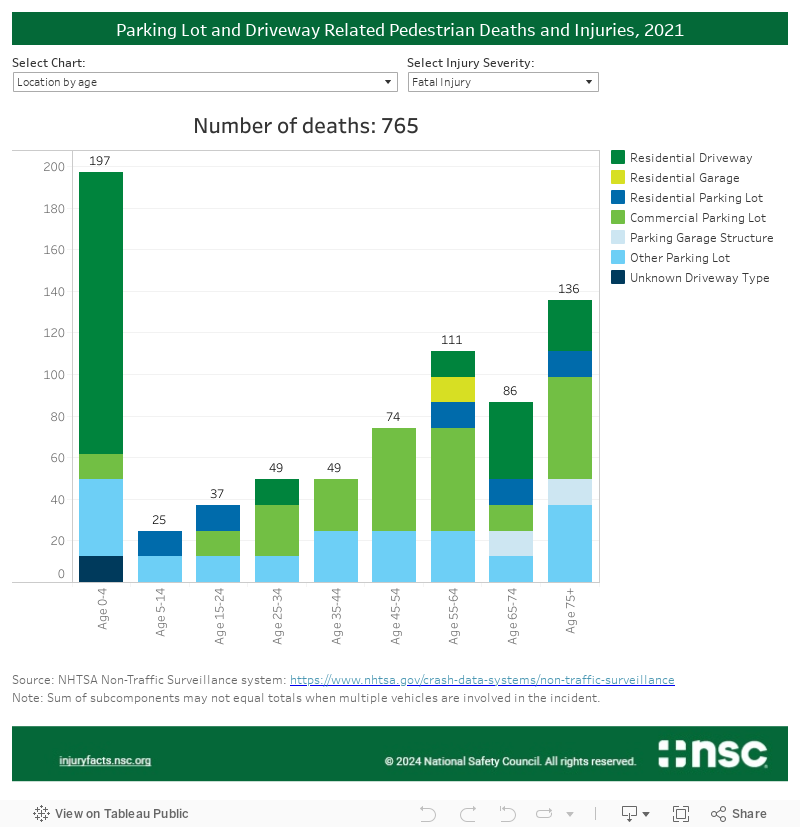
Data available from NHTSA primarily focus on crashes involving public trafficways and exclude incidents occurring on driveways and in parking lots. However, some non-traffic data are available through NHTSA’s Non-Traffic Surveillance System. The visualization below illustrates the number of pedestrian deaths and nonfatal injuries occurring in parking lots and driveways. Use the visualization to explore these pedestrian incidents by location of crash, movement of vehicle striking the pedestrian, month of crash, and age of pedestrian. As can be seen, children age 0 to 4 experienced the most fatalities in 2021. The largest share of these deaths resulted from crashes occurring on residential driveways. Adults, aged 45 to 54, experienced the most nonfatal injuries. The largest proportion of injuries resulted from crashes occurring in commercial parking lots.
- Chart
- Data Table
Source: NSC analysis of NHTSA FARS data