Disparities by Race or Ethnic Origin
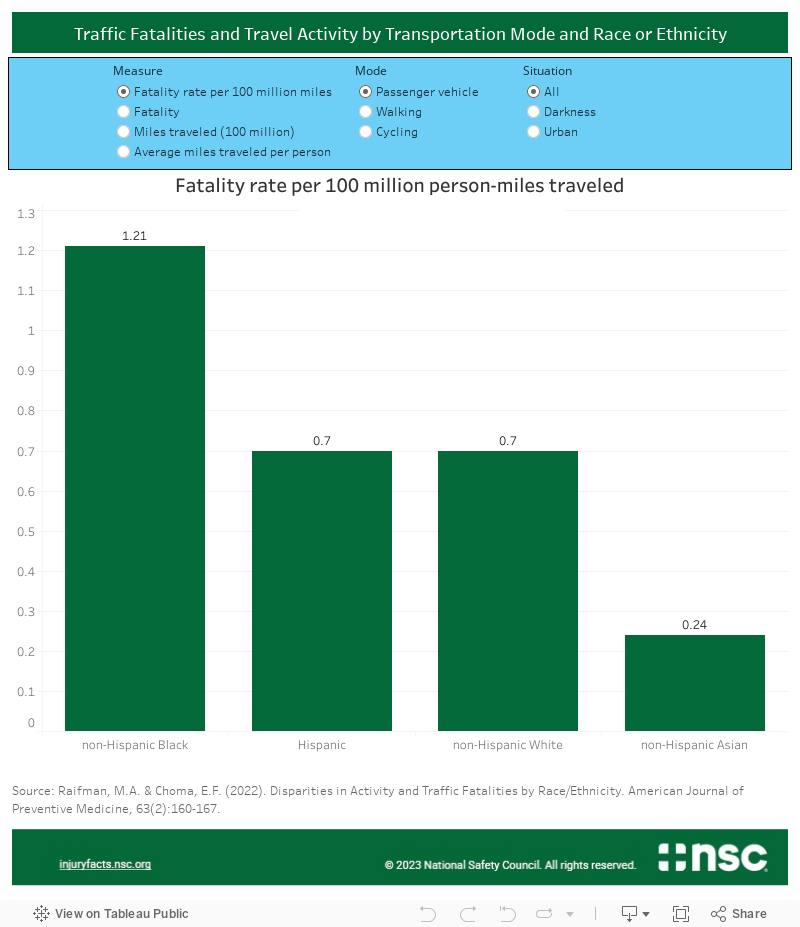
A study published in the American Journal of Preventive Medicine found:
- Non-Hispanic Blacks experience a passenger vehicle fatality rate 73% higher than non-Hispanic whites
- Non-Hispanic Blacks experience a pedestrian (walking) death rate 118% higher than non-Hispanic whites
- Non-Hispanic Blacks experience a cycling fatality rate 348% higher than non-Hispanic whites
- Non-Hispanic Asians experience the lowest rates across all three transportation modes
The disparities are even sharper when comparing fatality rates for pedestrian (walking) deaths occurring at night:
- Non-Hispanic Black pedestrians experience a fatality rate 236% higher than non-Hispanic whites
- Hispanic or Latino pedestrians experience a fatality rate 84% higher than non-Hispanic whites
Explore other race or ethnic origin comparisons using the chart below. By adjusting the filters, data on fatality rates, fatalities, person miles traveled, and average miles traveled per person by race or ethnic origin are available.
- Chart
- Data Table
These fatality rate comparisons are calculated based on 100 million person miles traveled using data collected by the 2017 National Household Travel Survey (NHTS) and 2016-2018 National Highway Traffic Safety Administration (NHTSA) Fatality Analysis Reporting System (FARS). The 2017 NHTS is a nationally representative survey of travel behavior conducted from April 2016 through April 2017. The 2017 survey is the latest in the series updated in 1969, 1977, 1983, 1990, 1995, 2001, and 2009.
During the survey period, researchers collected data from roughly 130,000 households, representing 275,000 U.S. residents, that were sampled based on postal address lists. They mailed sampled households a survey form with a small incentive and asked them to join the survey by either logging on to the website or mailing the form back. Each participating household reported all travel by household members on a randomly assigned 24-hour single “travel day.” They assigned travel days for all seven days of the week, including all holidays. Weighting reflected the day of week and month of travel to allow comparisons of weekdays or seasons.
Given that yearly mileage estimates are not available, converting NHTS fatality data mileage-based fatality rates by race or ethnic origin is not possible. Without mileage-based fatality rates, simply tracking the number of fatalities does not uncover the relative fatality risk faced by groups. As shown in the three line charts below, white non-Hispanics experience far more passenger vehicle occupant deaths, pedestrian deaths, and cycling deaths than any other group. Without the context provided by the mileage-based fatality rates, a full picture of the risks faced by different groups is not possible.
Even without the necessary context provided by rates, a few trends are evident over the last 10 years:
- Hispanic or Latino passenger vehicle occupant deaths have increased by 88%.
- Black, non-Hispanic passenger vehicle occupant deaths have increased by 52%.
- Asian, non-Hispanic passenger vehicle occupant deaths have increased by 14%.
- White, non-Hispanic passenger vehicle occupant deaths have decreased by 3%.
- American Indian passenger vehicle occupant deaths have decreased by 14%.
- Chart
- Data Table
Pedestrian fatality trends show that over the last 10 years:
- Hispanic or Latino pedestrian deaths have increased by 102%.
- Black, non-Hispanic pedestrian deaths have increased by 75%.
- White, non-Hispanic pedestrian deaths have increased by 30%.
- American Indian pedestrian deaths have increased by 26%.
- Asian, non-Hispanic pedestrian deaths have decreased by 11%.
- Chart
- Data Table
Bicycling fatality trends show that over the last 10 years:
- Bicycling fatalities among American Indians have increased by 300%.
- Bicycling fatalities among Hispanics or Latinos have increased by 72%.
- Bicycling fatalities among Black non-Hispanics have increased by 64%.
- Bicycling fatalities among white non-Hispanics have increased by 62%.
- Bicycling fatalities among Asian non-Hispanics have decreased by 9%.
- Chart
- Data Table
Source: Raifman, M.A. & Choma, E.F. (2022). Disparities in Activity and Traffic Fatalities by Race/Ethnicity. American Journal of Preventive Medicine, 63(2):160-167.
Fatality trend data: National Safety Council (NSC) analysis of NHTSA FARS data