School Bus
School bus-related crashes killed 108 people nationwide in 2021, up 50% compared to the pandemic-related low number of 54 deaths in 2020, according to National Safety Council (NSC) tabulations of data from the National Highway Traffic Safety Administration (NHTSA).
A school bus-related crash is defined by NHTSA as any crash in which a vehicle, regardless of body design, used as a school bus is directly or indirectly involved. This includes incidents involving school children getting in or out of a vehicle.
From 2012 to 2021, about 70% of the deaths in school bus-related crashes were occupants of vehicles other than the school bus, and 16% were pedestrians. About 5% were school bus passengers, 5% were school bus drivers, and 3% were pedalcyclists.
Of the people injured in school bus-related crashes from 2012 to 2021, about 30% were school bus passengers, 9% were school bus drivers, and 53% were occupants of other vehicles. The remainder were pedestrians, pedalcyclists, and other or unknown.
Characteristics of school bus transportation
According to the Schoolbus Fleet, in the 2021-22 school year an estimated 489,748 yellow school buses provide transportation service daily in the United States. About 20.5 million elementary and secondary school children ride school buses to and from school each day.
School buses are the best option for transporting kids to school, safer than both walking or riding in a car. NSC supports the adoption of lap-and-shoulder belt safety restraints to make them even safer.
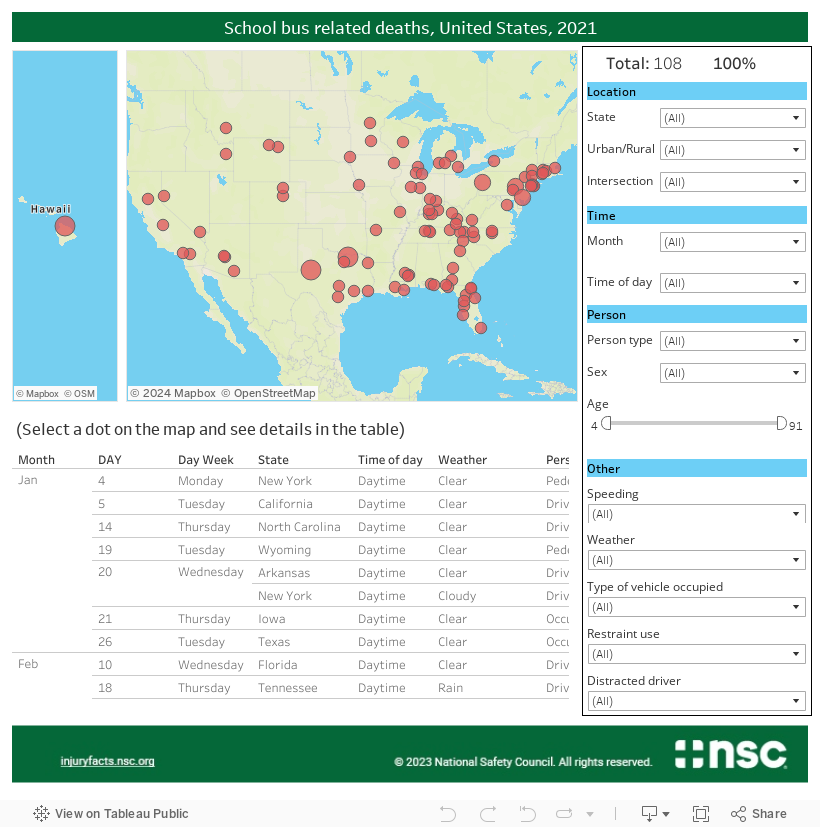
The interactive map allows you to explore crash details of the 108 school bus-related fatal crashes in 2021. The filters on the right side of the map allow you to search for crashes by state, weather conditions, and indicate if speeding or distracted driving was reported as contributing circumstances. More details are also available by hovering over the red circular crash symbols.
- Chart
- Data Table
Sources:
- Fatality data are NSC tabulations of Fatality Analysis Reporting System (FARS) data.
- Injury data are NSC tabulations of the NHTSA Crash Report Sampling System.
- School bus transportation data accessed April 14, 2023, from Schoolbus Fleet